
(All screen shots below are from a pre-release beta version of ArbMaker. Click images to enlarge. Back tester screenshots coming soon…)
Screen shots 1 & 2:
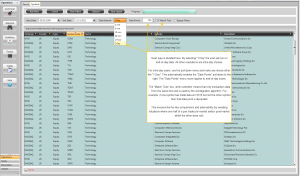
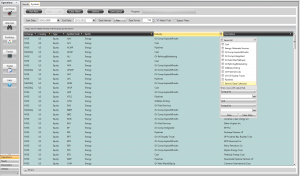
The left side Outlook Bar navigates between views. It consists of 2 main areas: Symbol Management with views for Countries, Exchanges and Symbols; and Operations which handles Cointegration crunching and Watch lists. Data can be grouped by selecting and dragging the columns the user wants to the Group Area above the Grid. In the examples symbols have been grouped by sector and industry; and there is a overall view of the entire database by country. Users can cut pair searches right down to the industry level across all geographies in the database.
Screen shot 3:
Price data for individual symbols comes up when the “View” button is clicked. The chart has two areas: one showing the adjusted closing price and volume on the top (zoomable and scrollable); and the other showing a candlestick chart for the selected zoom period.
Screen shot 4:
A shot of the cointegration process in operation following pair generation. ArbMaker processes as many as 20 pairs per second (and we hope to maintain that through to the release version) depending upon the quality of the web connection and the amount of RAM memory. All long lasting processes occur in background threads and have progress indicators.
Screen shot 5:
Post-cointegration the user can view detailed results within the grid and/or choose any chart(s) from the top menu bar. Charts appear initially as pop-ups that can be resized and placed anywhere in the working area. When the user selects another pair, all open charts update accordingly. Charts can be ‘docked’ automatically and will resize as a function of how many are open. Each chart has zoom in/out functionality enabling focus on selected periods. Note also the column controls for the main grid on the left of the screen permitting customisation of the results display.
Screen shot 6:
An example screen post-cointegration. Users can switch between results and the symbols listings. Pairs of interest can be saved by clicking the “Watchlist” radio button which places them apart from the main list and updates them (automatically or manually).
Screen shot 7:
Screen real estate can be configured exactly to user requirements with minimum effort. Any chart or data table can be tabbed or untabbed with another. In the shot below multiple graphs have been nested one inside the other.
Screen shot 8:
The Outlook navigation area to the left can also be collapsed to provide additional screen space.
Screen gallery
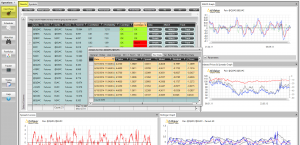 Select and copy/paste data from ArbMaker into 3rd party software such as Excel
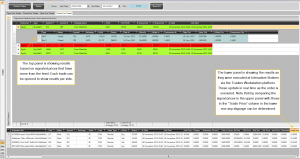
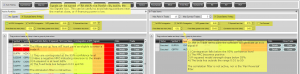 Shot from the documentation explaining how the Dynamic Filters protect individual pairs/strategies during live tracking & trading
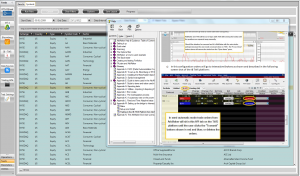 Integrated & comprehensive Help file
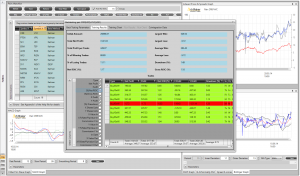 ...and the result from a back test on display...
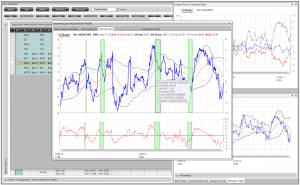 ...which can further be represented visually - hover on green/red trade bars to pull up underlying data box
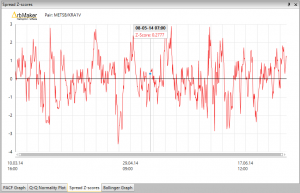 An example of Z-score chart output
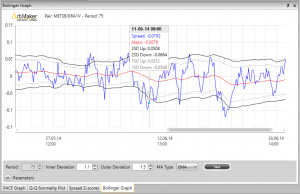 A Bollinger Band graph with data window and adjustable parameters.
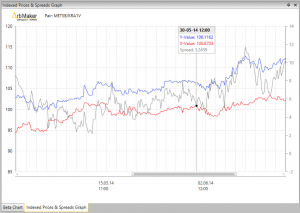 An Indexed Prices & Spread graph with data window.
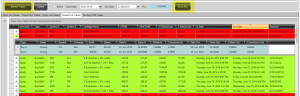 A shot of the internal record of simulated trades made in ArbMaker
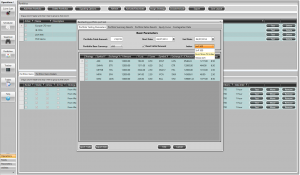 The Portfolio backtester with choice of index comparators
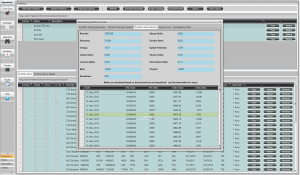 Portfolio backtester showing some result data and ratios
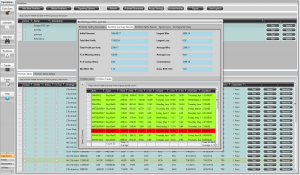 View detailed trade data inside the Portfolio backtester
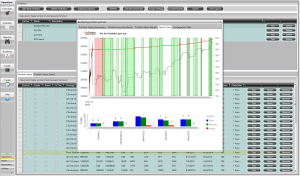 Equity curve from the Portfolio backtester
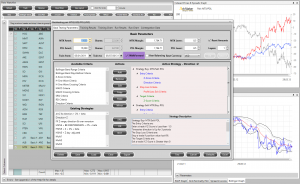 The back tester will perform out-of-sample walk forward tests
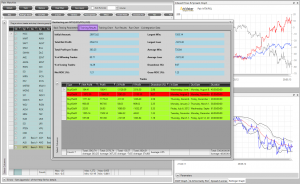 Here it has 'trained' from 5 January 2011 to 5 July 2013
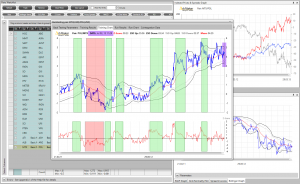 The results look like this with the end date of the training period highlighted in purple
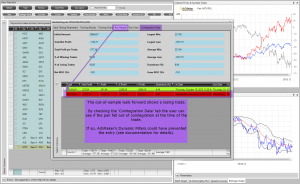 The walk forward since July 2013 looks less good - but was the losing trade one the trader would have taken?
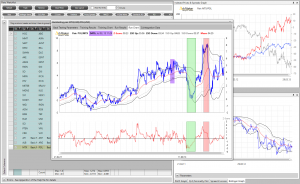 The walk forward trades look thus with the start of the out-of-sample period highlighted in purple.
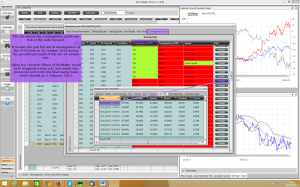 In this case that final losing trade could have been insured against.
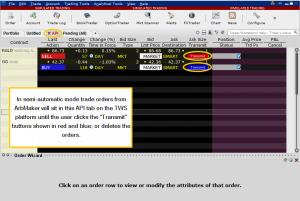 ArbMaker can trade either semi-automatically or fully automatically to Interactive Brokers platform TWS
 A shot of the internal record of live trading to IB's TWS platform
 The mechanics of setting-up a scan. The software handles end-of-day and intraday requests
 Scans can be finely targeted right down to the Industry level. By default we use a Bloomberg methodology for cutting Sector/Industry.
 Flexible commission creation structure...
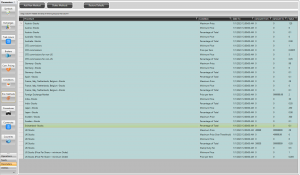 ...permits specific commission methods per traded market
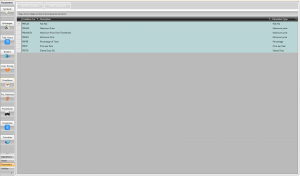
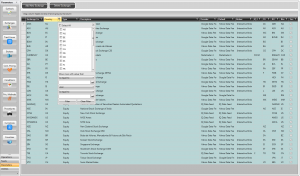 Wide selection of exchanges available by default with the ability to add more
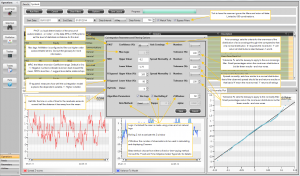 Definable scan parameters: target specific cointegration & normality profiles.
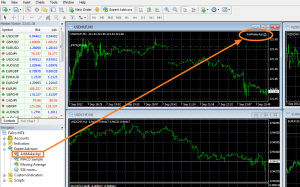 ArbMaker can use MT4 data to crunch its algorithms and trade automatically and semi-automatically with the MT4 broker. ArbMaker can also run multiple MT4 feeds at the same time.
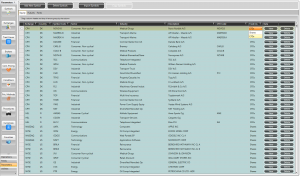 Ability to trade Contracts for Difference. Advantage: greater leverage in an inherently hedged method. Disadvantages: CFDs are not available for all equities; and the finance charges can hurt the longer a trade is open
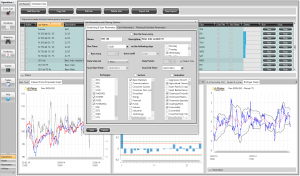 Schedule periodic scans of Exchanges/Sectors/Industries that execute automatically. Produces highly focused list of pre-vetted pairs for final assessment.
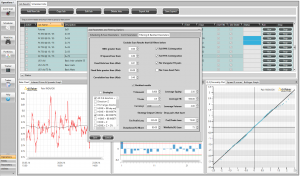 Test multiple strategies in a single Scheduler job. Results find optimum strategy per pair. Automatic filtering of scan results based on user selected criteria (total profit/trade profit/drawdown and winning ratio)
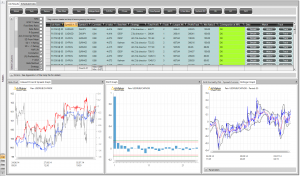 Scheduler results from several scheduled FX jobs. Filterable by any visible column
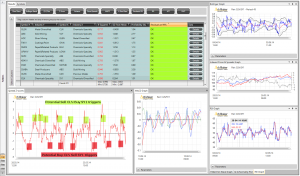 An example of scan output for Swiss-quoted Clariant AG and German-quoted Symrise AG.
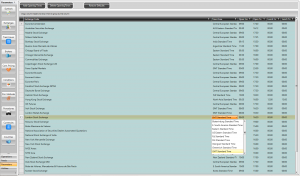 Exchange hour settings. Can be modified to stop ArbMaker trading at certain times. They also are used in this screen to convert feed timestamps to UTC (Coordinated Universal Time) for cross time-zone trading
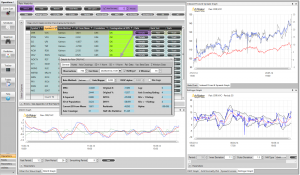 The detail behind all pairs can easily be made visible. User notes can also be added. In addition, this shot of the Watchlist shows the control for auto refreshing data.
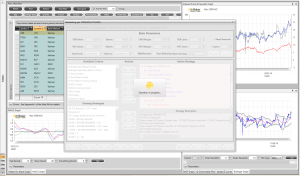 A back test in progress...